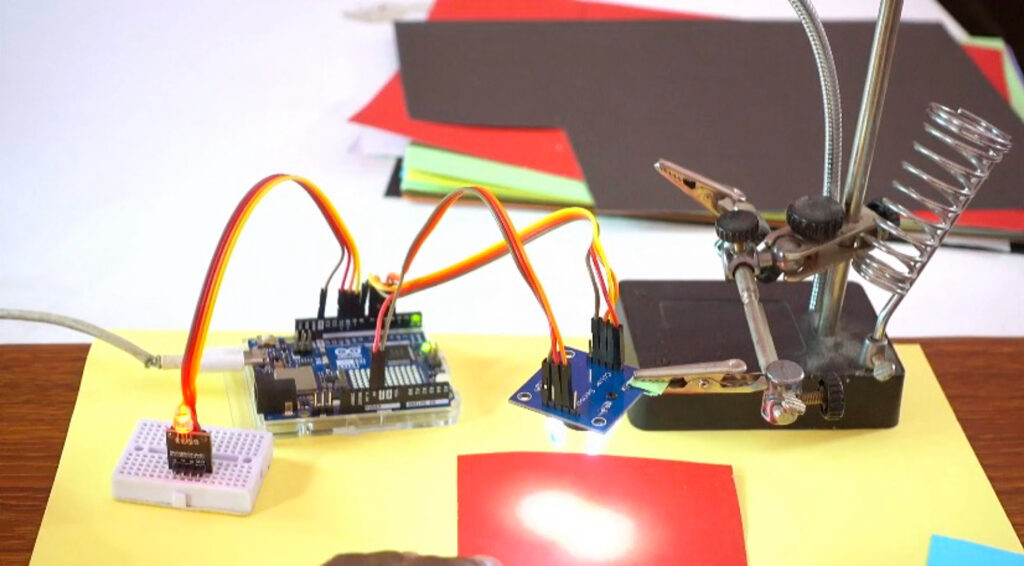

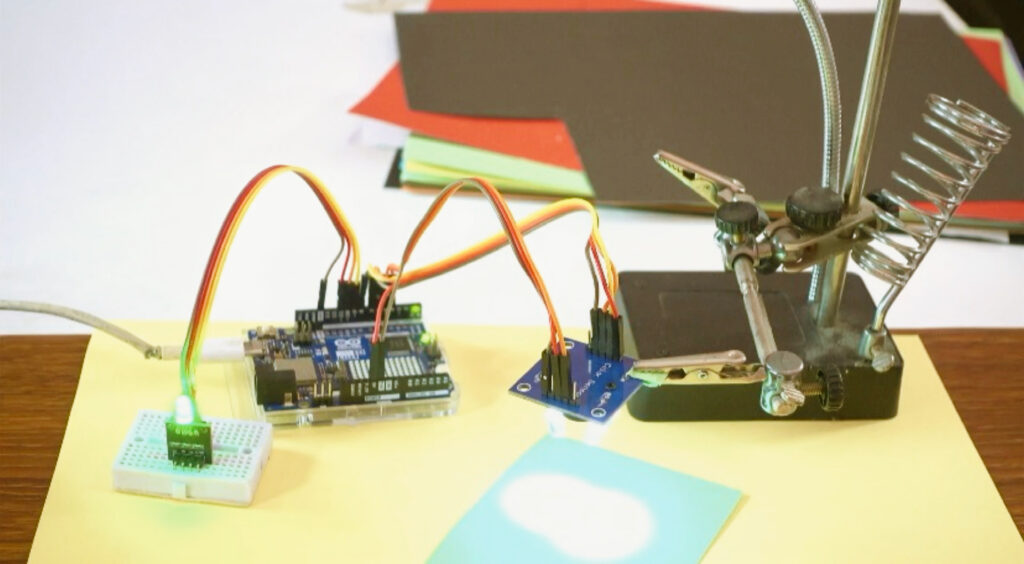
Control RGB LED Colors with TCS3200 Color Sensor & Arduino Uno R4 WiFi
Robotics, automated quality control, and interactive displays all depend heavily on color sensing technology. In order to detect surface colors in real time and ignite a corresponding RGB LED (Red, Green, or Blue) based on the detected target object, we will link a TCS3200 color light-to-frequency sensor to an Arduino Uno R4 WiFi in this project. Our system can automatically extract primary colors and trigger corresponding visual outputs by analyzing the square wave output frequencies produced by the TCS3200 sensor, mapping raw pulse widths against calibrated white and black reference values, and evaluating various RGB thresholds.
What is the TCS3200 Color Sensor?
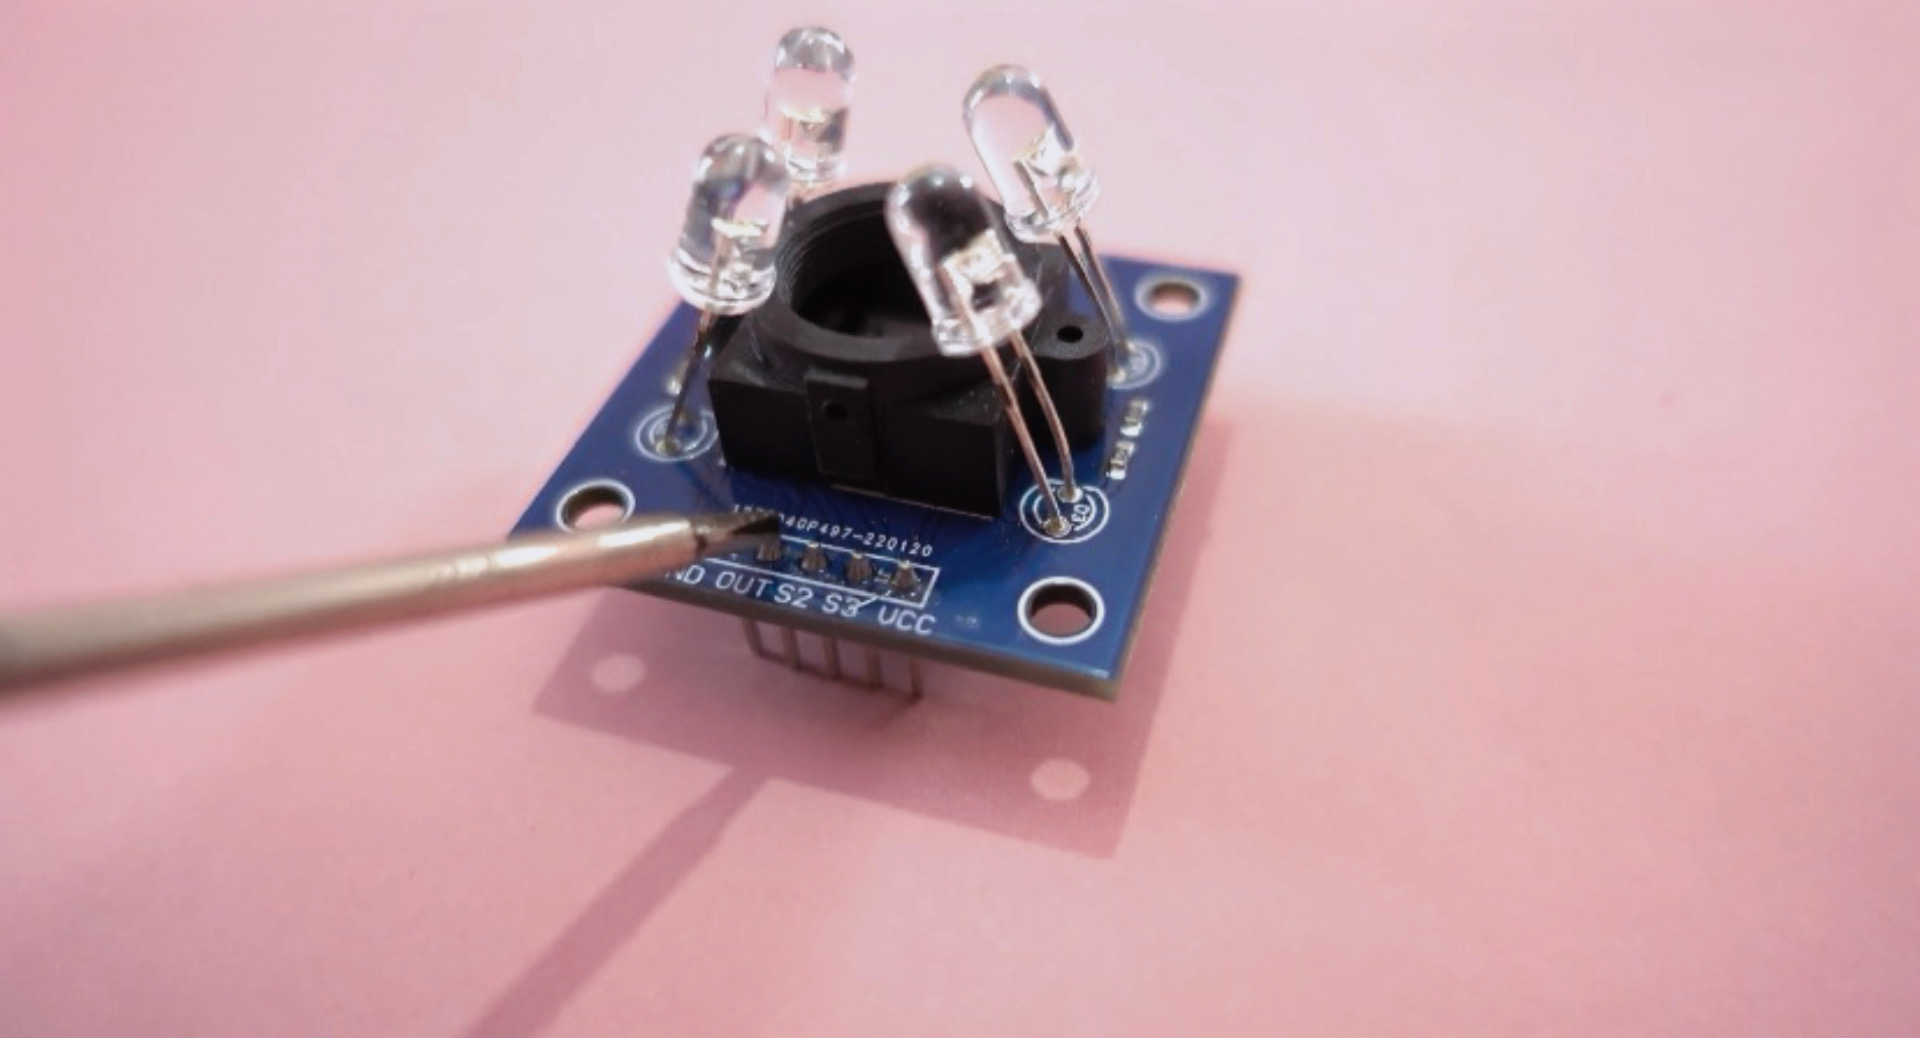
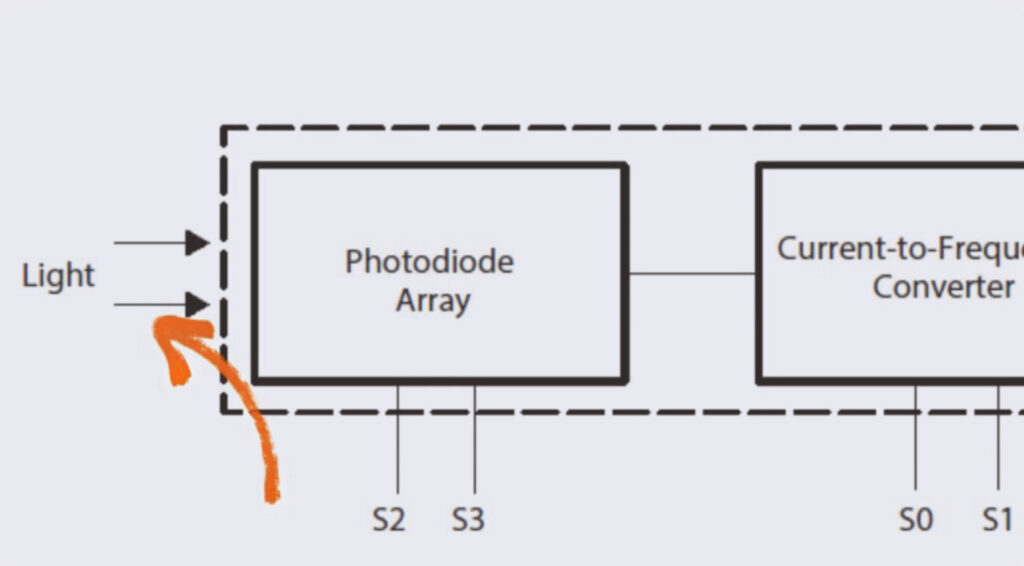
The TCS3200 (and its TCS3210 variant) is a programmable color light-to-frequency converter that combines configurable silicon photodiodes and a current-to-frequency converter on a single monolithic CMOS integrated circuit.
The output is a 50% duty cycle square wave whose frequency is directly proportional to light intensity (irradiance).
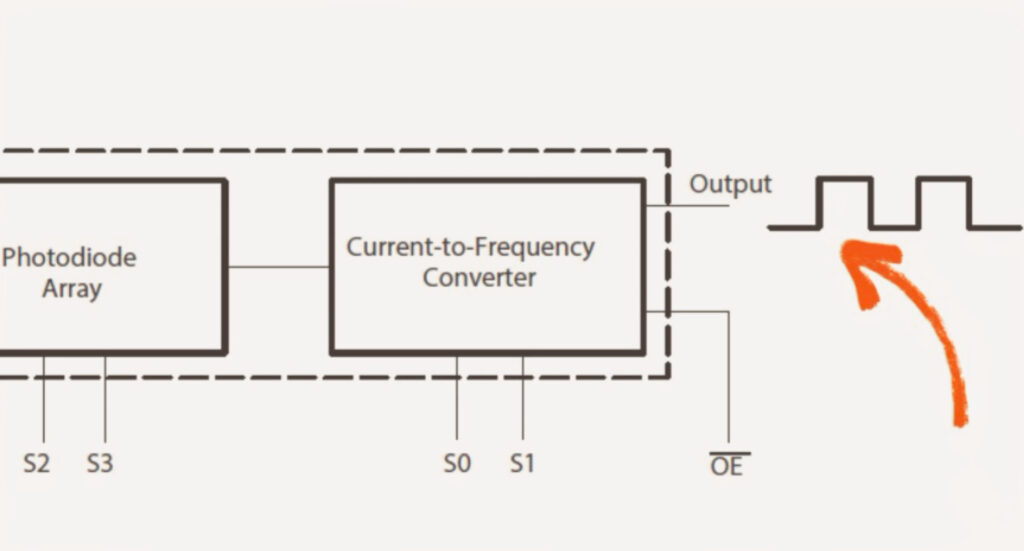
The full-scale output frequency can be scaled to 100%, 20%, or 2% using two control input pins (S0 and S1), making it easy to interface directly with microcontroller digital pins.
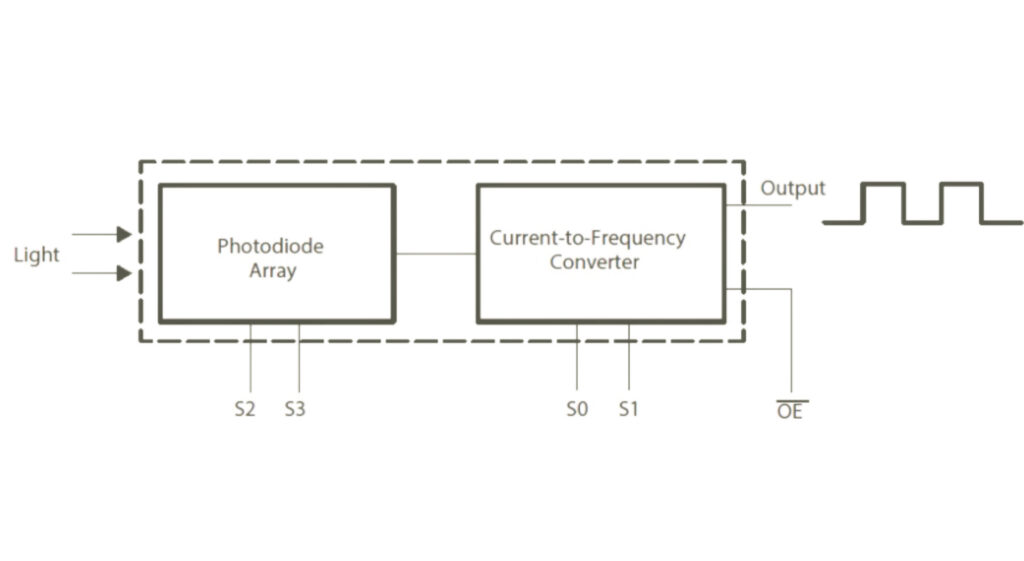
Inside the chip, light is read by an 8×8 photodiode array (64 photodiodes total):
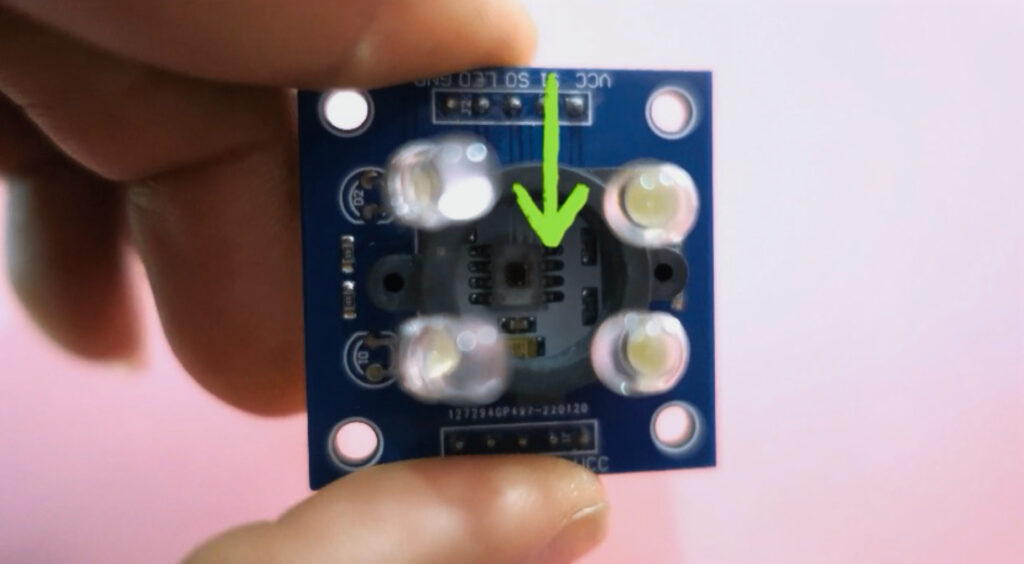
- 16 photodiodes have red filters
- 16 photodiodes have green filters
- 16 photodiodes have blue filters
- 16 photodiodes are clear (no filter)
These four photodiode groups are interdigitated to minimize non-uniformity across incident light. Selector pins S2 and S3 choose which set of photodiodes is currently active.
Components Used
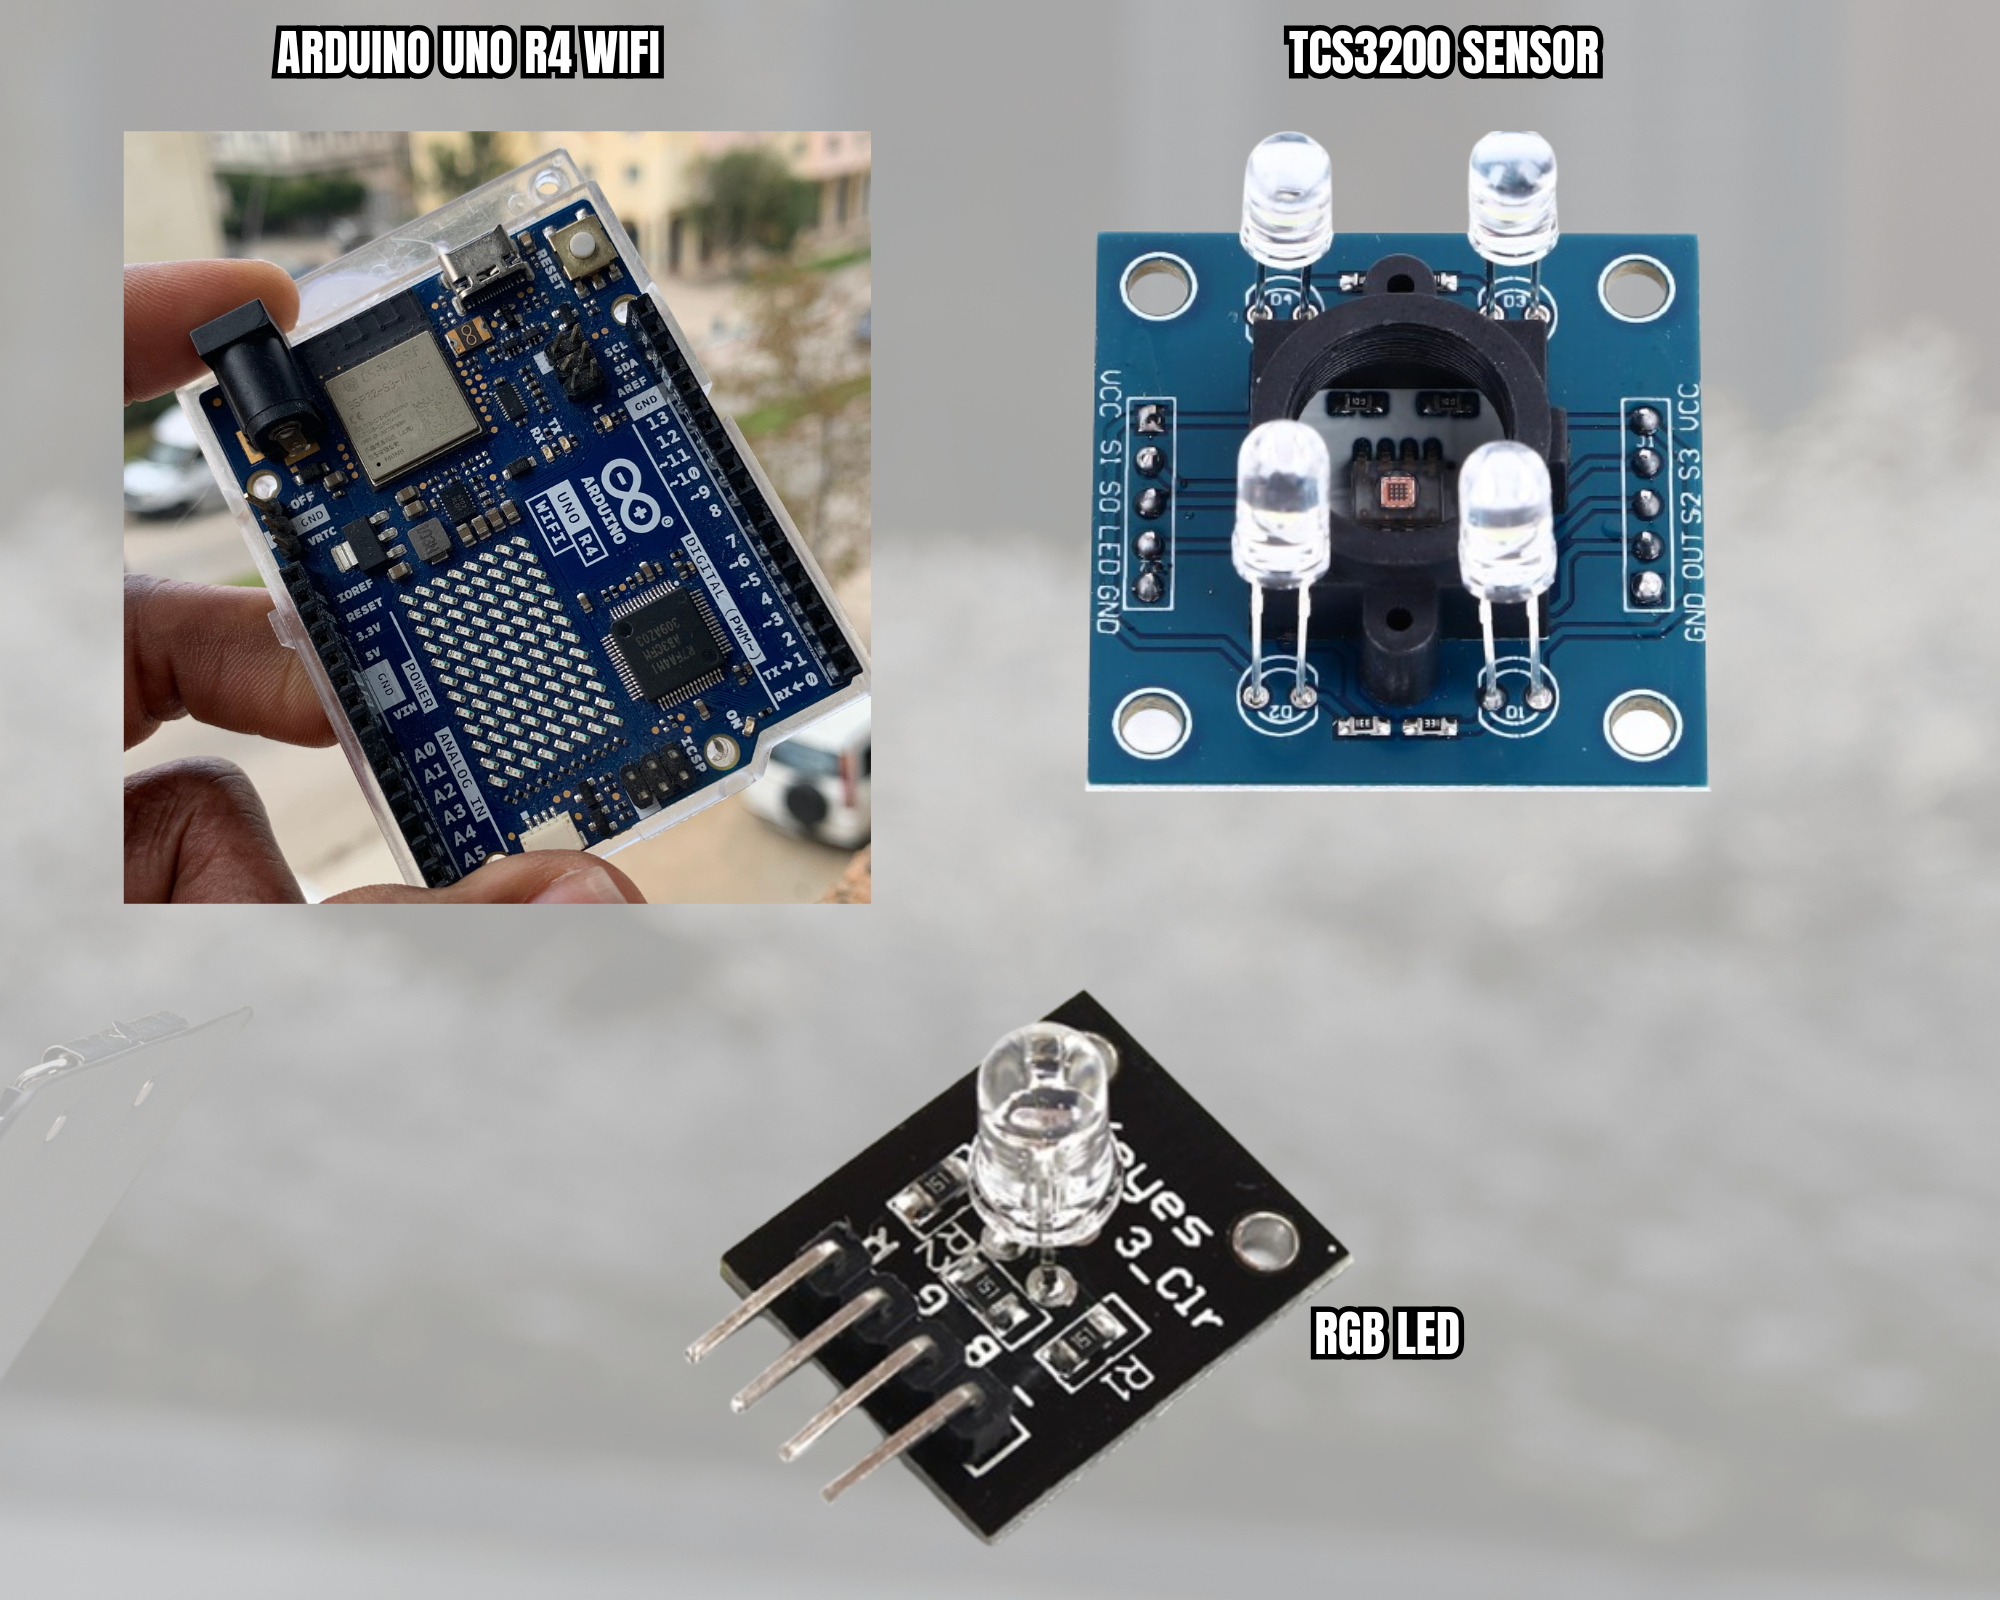
- Arduino Uno R4 WiFi
- TCS3200 Color Sensor Module
- Common Cathode RGB LED
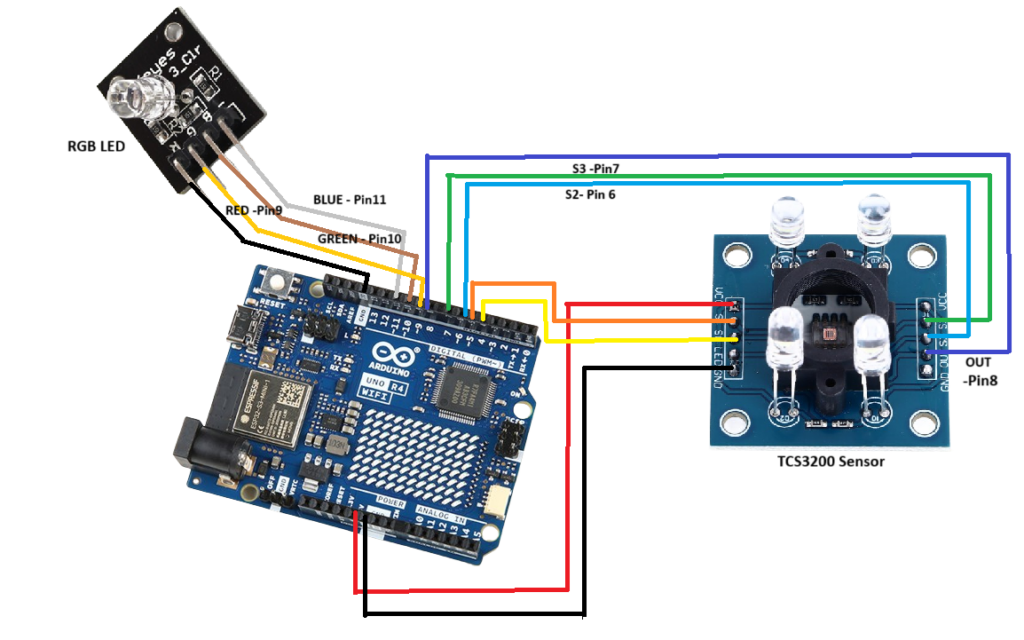
Circuit Schematic & Pin Wiring
Required Libraries
There isn’t any external third-third-third-third-third-third-third-third-third-third-party project. Only native Arduino functions are used in the calibration and color matching sketches:
pulseIn()– Measures the duration of digital pulses generated by the TCS3200 sensor.map()– Transforms raw pulse width measurements into standard 8-bit RGB values (0–255).
Arduino Code
Step 1: Calibration Code
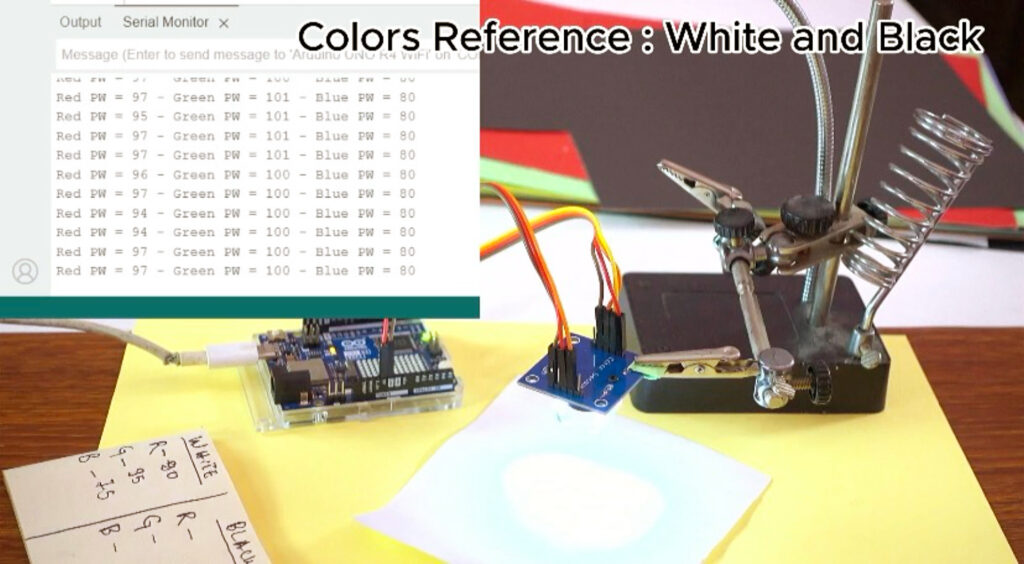
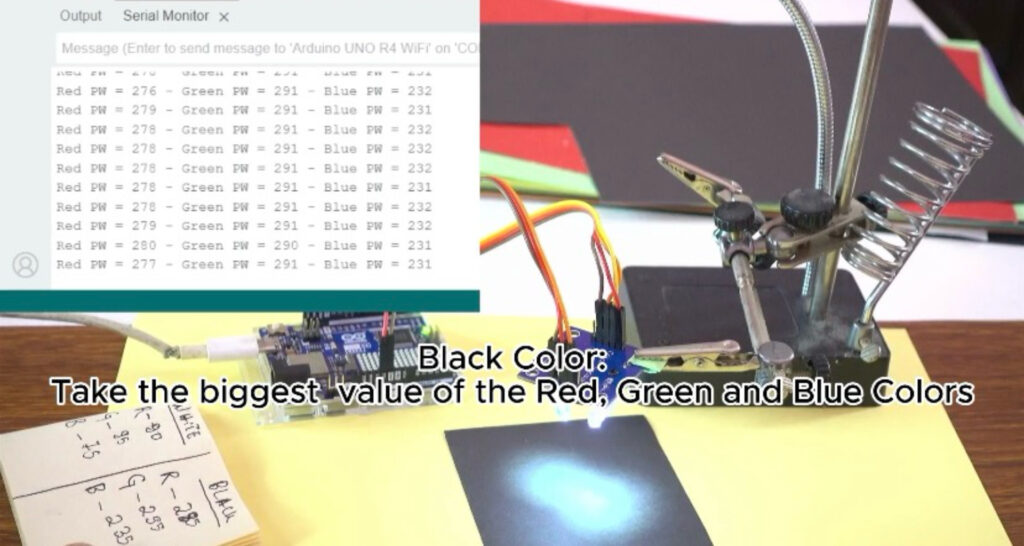
The sensor needs to be calibrated using pure white and pure black surfaces before it can identify distinct colors.
Place a white object (e.g., white paper) roughly 1–2 cm in front of the sensor to record the minimum pulse width values (redMin, greenMin, blueMin).
Place a black object in front of the sensor to record the maximum pulse width values (redMax, greenMax, blueMax).
// Define color sensor pins
#define S0 4
#define S1 5
#define S2 6
#define S3 7
#define sensorOut 8

// Variables for Color Pulse Width Measurements
int redPW = 0;
int greenPW = 0;
int bluePW = 0;

void setup() {
  // Set S0 - S3 as outputs
  pinMode(S0, OUTPUT);
  pinMode(S1, OUTPUT);
  pinMode(S2, OUTPUT);
  pinMode(S3, OUTPUT);

  // Set Sensor output as input
  pinMode(sensorOut, INPUT);

  // Set Pulse Width scaling to 20%
  digitalWrite(S0, HIGH);
  digitalWrite(S1, LOW);

  // Setup Serial Monitor
  Serial.begin(9600);
}

void loop() {
  // Read Red Pulse Width
  redPW = getRedPW();
  delay(200);

  // Read Green Pulse Width
  greenPW = getGreenPW();
  delay(200);

  // Read Blue Pulse Width
  bluePW = getBluePW();
  delay(200);

  // Print output to Serial Monitor
  Serial.print("Red PW = ");
  Serial.print(redPW);
  Serial.print(" - Green PW = ");
  Serial.print(greenPW);
  Serial.print(" - Blue PW = ");
  Serial.println(bluePW);
}

// Function to read Red Pulse Widths
int getRedPW() {
  digitalWrite(S2, LOW);
  digitalWrite(S3, LOW);
  return pulseIn(sensorOut, LOW);
}

// Function to read Green Pulse Widths
int getGreenPW() {
  digitalWrite(S2, HIGH);
  digitalWrite(S3, HIGH);
  return pulseIn(sensorOut, LOW);
}

// Function to read Blue Pulse Widths
int getBluePW() {
  digitalWrite(S2, LOW);
  digitalWrite(S3, HIGH);
  return pulseIn(sensorOut, LOW);
}
Step 2: Mapping RGB Values Code
Insert your min and max calibration values obtained from Step 1 into redMin, redMax, greenMin, greenMax, blueMin, and blueMax to map raw measurements to standard 0–255 RGB color values.
// Define color sensor pins
#define S0 4
#define S1 5
#define S2 6
#define S3 7
#define sensorOut 8

// Calibration Values (Replace with values from Calibration Sketch)
int redMin = 90;    // Red minimum value (from white calibration)
int redMax = 285;   // Red maximum value (from black calibration)
int greenMin = 95;  // Green minimum value
int greenMax = 295; // Green maximum value
int blueMin = 75;   // Blue minimum value
int blueMax = 235;  // Blue maximum value

// Variables for Color Pulse Width Measurements
int redPW = 0;
int greenPW = 0;
int bluePW = 0;

// Variables for final Color values
int redValue;
int greenValue;
int blueValue;

void setup() {
  pinMode(S0, OUTPUT);
  pinMode(S1, OUTPUT);
  pinMode(S2, OUTPUT);
  pinMode(S3, OUTPUT);

  pinMode(sensorOut, INPUT);

  // Set Frequency scaling to 20%
  digitalWrite(S0, HIGH);
  digitalWrite(S1, LOW);

  Serial.begin(9600);
}

void loop() {
  // Read and map Red value
  redPW = getRedPW();
  redValue = map(redPW, redMin, redMax, 255, 0);
  delay(200);

  // Read and map Green value
  greenPW = getGreenPW();
  greenValue = map(greenPW, greenMin, greenMax, 255, 0);
  delay(200);

  // Read and map Blue value
  bluePW = getBluePW();
  blueValue = map(bluePW, blueMin, blueMax, 255, 0);
  delay(200);

  // Print RGB mapped output to Serial Monitor
  Serial.print("Red = ");
  Serial.print(redValue);
  Serial.print(" - Green = ");
  Serial.print(greenValue);
  Serial.print(" - Blue = ");
  Serial.println(blueValue);
}

int getRedPW() {
  digitalWrite(S2, LOW);
  digitalWrite(S3, LOW);
  return pulseIn(sensorOut, LOW);
}

int getGreenPW() {
  digitalWrite(S2, HIGH);
  digitalWrite(S3, HIGH);
  return pulseIn(sensorOut, LOW);
}

int getBluePW() {
  digitalWrite(S2, LOW);
  digitalWrite(S3, HIGH);
  return pulseIn(sensorOut, LOW);
}
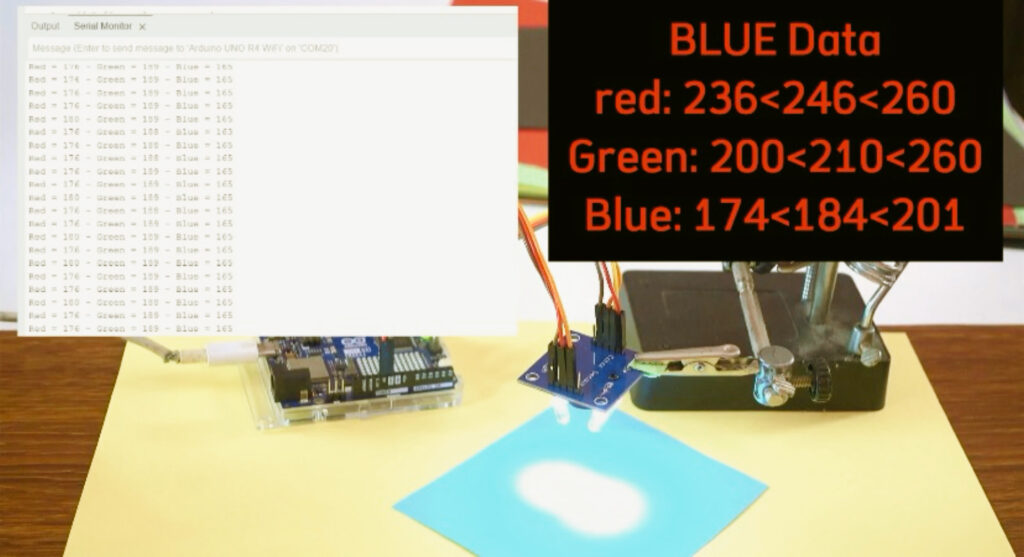
Blue color data
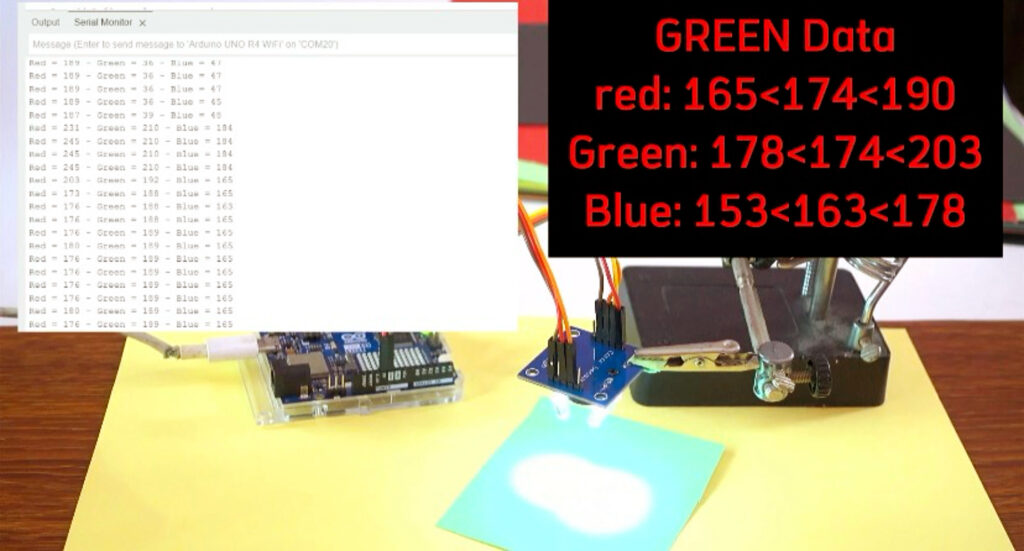
Green color data
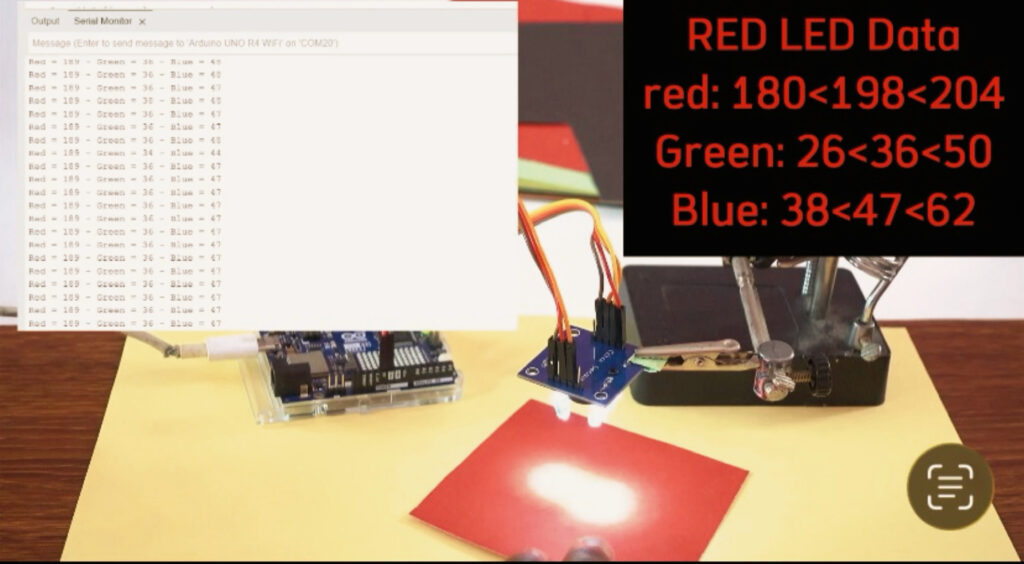
Red color data
Step 3: Final RGB LED Control Code
This complete code evaluates mapped RGB ranges to identify Red, Green, or Blue objects and powers the corresponding pin of the RGB LED HIGH while turning off the others.
// Define LED and Color Sensor Pins
#define RedLED 9
#define GreenLED 10
#define BlueLED 11

#define S0 4
#define S1 5
#define S2 6
#define S3 7
#define sensorOut 8

// Calibration Values
int redMin = 90;    // Red minimum value
int redMax = 285;   // Red maximum value
int greenMin = 95;  // Green minimum value
int greenMax = 295; // Green maximum value
int blueMin = 75;   // Blue minimum value
int blueMax = 235;  // Blue maximum value

// Variables for Color Pulse Width Measurements
int redPW = 0;
int greenPW = 0;
int bluePW = 0;

// Variables for final Color values
int redValue;
int greenValue;
int blueValue;

void setup() {
  pinMode(S0, OUTPUT);
  pinMode(S1, OUTPUT);
  pinMode(S2, OUTPUT);
  pinMode(S3, OUTPUT);

  pinMode(RedLED, OUTPUT);
  pinMode(GreenLED, OUTPUT);
  pinMode(BlueLED, OUTPUT);

  pinMode(sensorOut, INPUT);

  // Set Frequency scaling to 20%
  digitalWrite(S0, HIGH);
  digitalWrite(S1, LOW);

  Serial.begin(9600);
}

void loop() {
  // Read Red value
  redPW = getRedPW();
  redValue = map(redPW, redMin, redMax, 255, 0);
  delay(200);

  // Read Green value
  greenPW = getGreenPW();
  greenValue = map(greenPW, greenMin, greenMax, 255, 0);
  delay(200);

  // Read Blue value
  bluePW = getBluePW();
  blueValue = map(bluePW, blueMin, blueMax, 255, 0);
  delay(200);

  // Evaluate Blue detection
  if (redValue > 236 && redValue < 260 && greenValue > 200 && greenValue < 260 && blueValue > 174 && blueValue < 201) {
    Serial.println("This is blue");
    digitalWrite(BlueLED, HIGH);
    digitalWrite(GreenLED, LOW);
    digitalWrite(RedLED, LOW);
  }
  // Evaluate Green detection
  else if (redValue > 165 && redValue < 190 && greenValue > 178 && greenValue < 203 && blueValue > 153 && blueValue < 178) {
    Serial.println("This is green");
    digitalWrite(BlueLED, LOW);
    digitalWrite(GreenLED, HIGH);
    digitalWrite(RedLED, LOW);
  }
  // Evaluate Red detection
  else if (redValue > 180 && redValue < 204 && greenValue > 26 && greenValue < 50 && blueValue > 38 && blueValue < 62) {
    Serial.println("This is red");
    digitalWrite(BlueLED, LOW);
    digitalWrite(GreenLED, LOW);
    digitalWrite(RedLED, HIGH);
  }
  // When target RGB primary colors are absent or non-matching target detected
  else if (redValue > 250 && redValue < 285 && greenValue > 250 && greenValue < 275 && blueValue > 190 && blueValue < 215) {
    Serial.println("Color: YELLOW");
    digitalWrite(BlueLED, LOW);
    digitalWrite(GreenLED, LOW);
    digitalWrite(RedLED, LOW);
  }
  else {
    digitalWrite(BlueLED, LOW);
    digitalWrite(GreenLED, LOW);
    digitalWrite(RedLED, LOW);
  }

  // Print output to Serial Monitor
  Serial.print("Red = ");
  Serial.print(redValue);
  Serial.print(" - Green = ");
  Serial.print(greenValue);
  Serial.print(" - Blue = ");
  Serial.println(blueValue);
}

// Function to read Red Pulse Widths
int getRedPW() {
  digitalWrite(S2, LOW);
  digitalWrite(S3, LOW);
  return pulseIn(sensorOut, LOW);
}

// Function to read Green Pulse Widths
int getGreenPW() {
  digitalWrite(S2, HIGH);
  digitalWrite(S3, HIGH);
  return pulseIn(sensorOut, LOW);
}

// Function to read Blue Pulse Widths
int getBluePW() {
  digitalWrite(S2, LOW);
  digitalWrite(S3, HIGH);
  return pulseIn(sensorOut, LOW);
}
How It Works
The TCS3200 sensor’s control pins S0 and S1 are configured by the Arduino Uno R4 WiFi to set its output frequency scaling to 20%, guaranteeing a clean frequency that can be read by conventional digital microcontroller inputs. By progressively switching pins S2 and S3, the sketch selectively activates the red, green, and blue filtered photodiode arrays within the sensor’s 8×8 grid. The pulseIn() function measures the low pulse duration emitted on pin 8 for each color channel, where more reflected light intensity generates shorter pulse widths.
Using stored white and black calibration boundaries, the sketch maps raw pulse widths to standard 0–255 RGB intensity levels using the map() function. Conditional logic then compares these calculated RGB values against defined color thresholds to determine if the target object is Red, Green, or Blue. When a matching primary color is recognized, the microcontroller drives the corresponding RGB LED pin HIGH (pins 9, 10, or 11) while turning the others LOW, delivering immediate visual confirmation of the detected color.
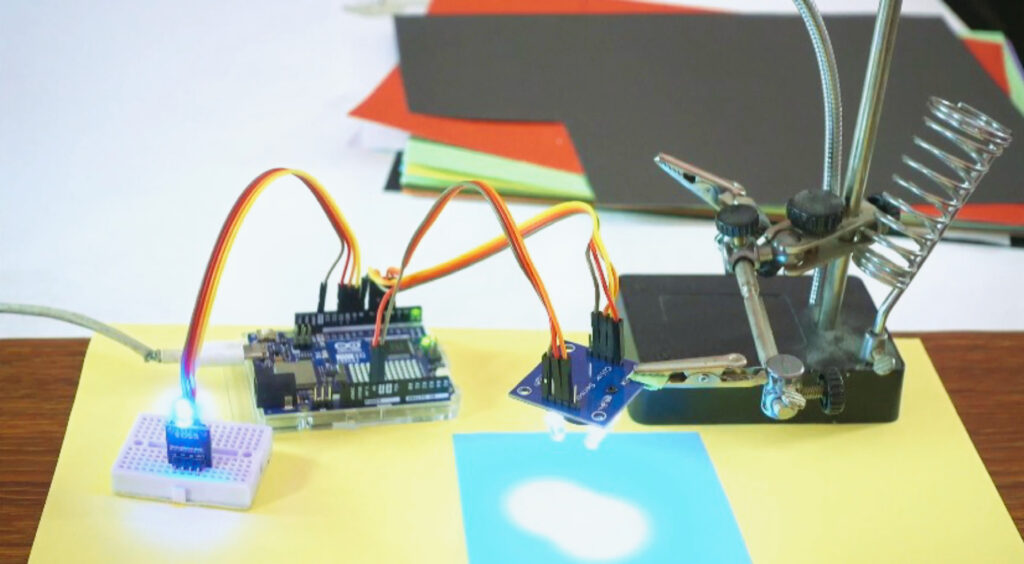
When the TCS3200 sensor is aligned over a blue object, the blue-filtered photodiodes register high light intensity, producing a significantly higher blue reading relative to red and green. The Arduino evaluates the mapped values against the blue threshold range (236 < Red < 260, 200 < Green < 260, and 174 < Blue < 201), prints “This is blue” to the Serial Monitor, and sets Digital Pin 9 (Blue LED) HIGH while grounding Pins 10 and 11 to keep the Green and Red channels completely off.
When a green object is positioned in front of the sensor, light reflects heavily through the green photodiode array. Once the sketch processes the pulse width signals and matches the specific green signature bounds (165 < Red < 190, 178 < Green < 203, and 153 < Blue < 178), the microcontroller outputs a HIGH signal on Digital Pin 10, driving the Green LED pin while deactivating the Red and Blue pins to visually signal green detection.

When a red object is placed under the sensor’s illumination LEDs, the red photodiodes detect maximum light reflection while the green and blue channels reflect lower relative levels. The logic condition validates the red target range (180 < Red < 204, 26 < Green < 50, and 38 < Blue < 62), outputs “This is red” to the serial output, and sets Digital Pin 11 (Red LED) HIGH to illuminate the Red LED terminal while turning off the Blue and Green pins.